Woodland Carbon Code statistics
Interim carbon unit statistics
Annual statistics
You can view offical annual statistics about the Woodland Carbon Code (up to 31 March 2023) in Forest Research’s Forestry Statistics 2023 publication - Chapter 4: Carbon.
Statistics from earlier years are also available.
Interim project statistics
Our interim statistics provide data on Woodland Carbon Code projects up to 31 March 2024.
Number of projects on UK Land Carbon Registry
| Number of projects | England | Wales | Scotland | Northern Ireland | UK |
|---|---|---|---|---|---|
|
Under development |
697 | 208 | 497 | 128 | 1,530 |
| Validated only | 102 | 39 | 344 | 9 | 494 |
| Verified at year 5 | 46 | 7 | 73 | 1 | 127 |
| Total validated | 148 | 46 | 417 | 10 | 621 |
| All projects | 845 | 254 | 914 | 138 | 2,151 |
Note: Projects can be validated/verified individually or as part of a group. This table shows the number of projects validated or verified, whether they were administered individually or as part of a group.
Area of projects on UK Land Carbon Registry
| Area (hectares) | England | Wales | Scotland | Northern Ireland | UK |
|---|---|---|---|---|---|
|
Under development |
7,840 | 2,249 | 36,945 | 865 | 47,899 |
| Validated only | 2,237 | 865 | 26,070 | 91 | 29,263 |
| Verified at year 5 | 697 | 145 | 3,915 | 9 | 4,765 |
| Total validated | 2,933 | 1,009 | 29,985 | 100 | 34,028 |
| All projects | 10,774 | 3,259 | 66,929 | 965 | 81,926 |
Projected carbon sequestration of projects
| Projected sequestration (million tCO2e) | England | Wales | Scotland | Northern Ireland | UK |
|---|---|---|---|---|---|
|
Under development |
3.2 | 0.8 | 11.4 | 0.4 | 15.7 |
| Validated only | 1.0 | 0.3 | 7.9 | 0.04 | 9.3 |
| Verified at year 5 | 0.4 | 0.07 | 1.6 | 0.003 | 2.1 |
| Total validated | 1.3 | 0.4 | 9.6 | 0.04 | 11.3 |
| All projects | 4.5 | 1.1 | 20.9 | 0.4 | 27.0 |
Note: These figures include both the carbon units which can be sold and those which are allocated to the Woodland Carbon Code buffer.
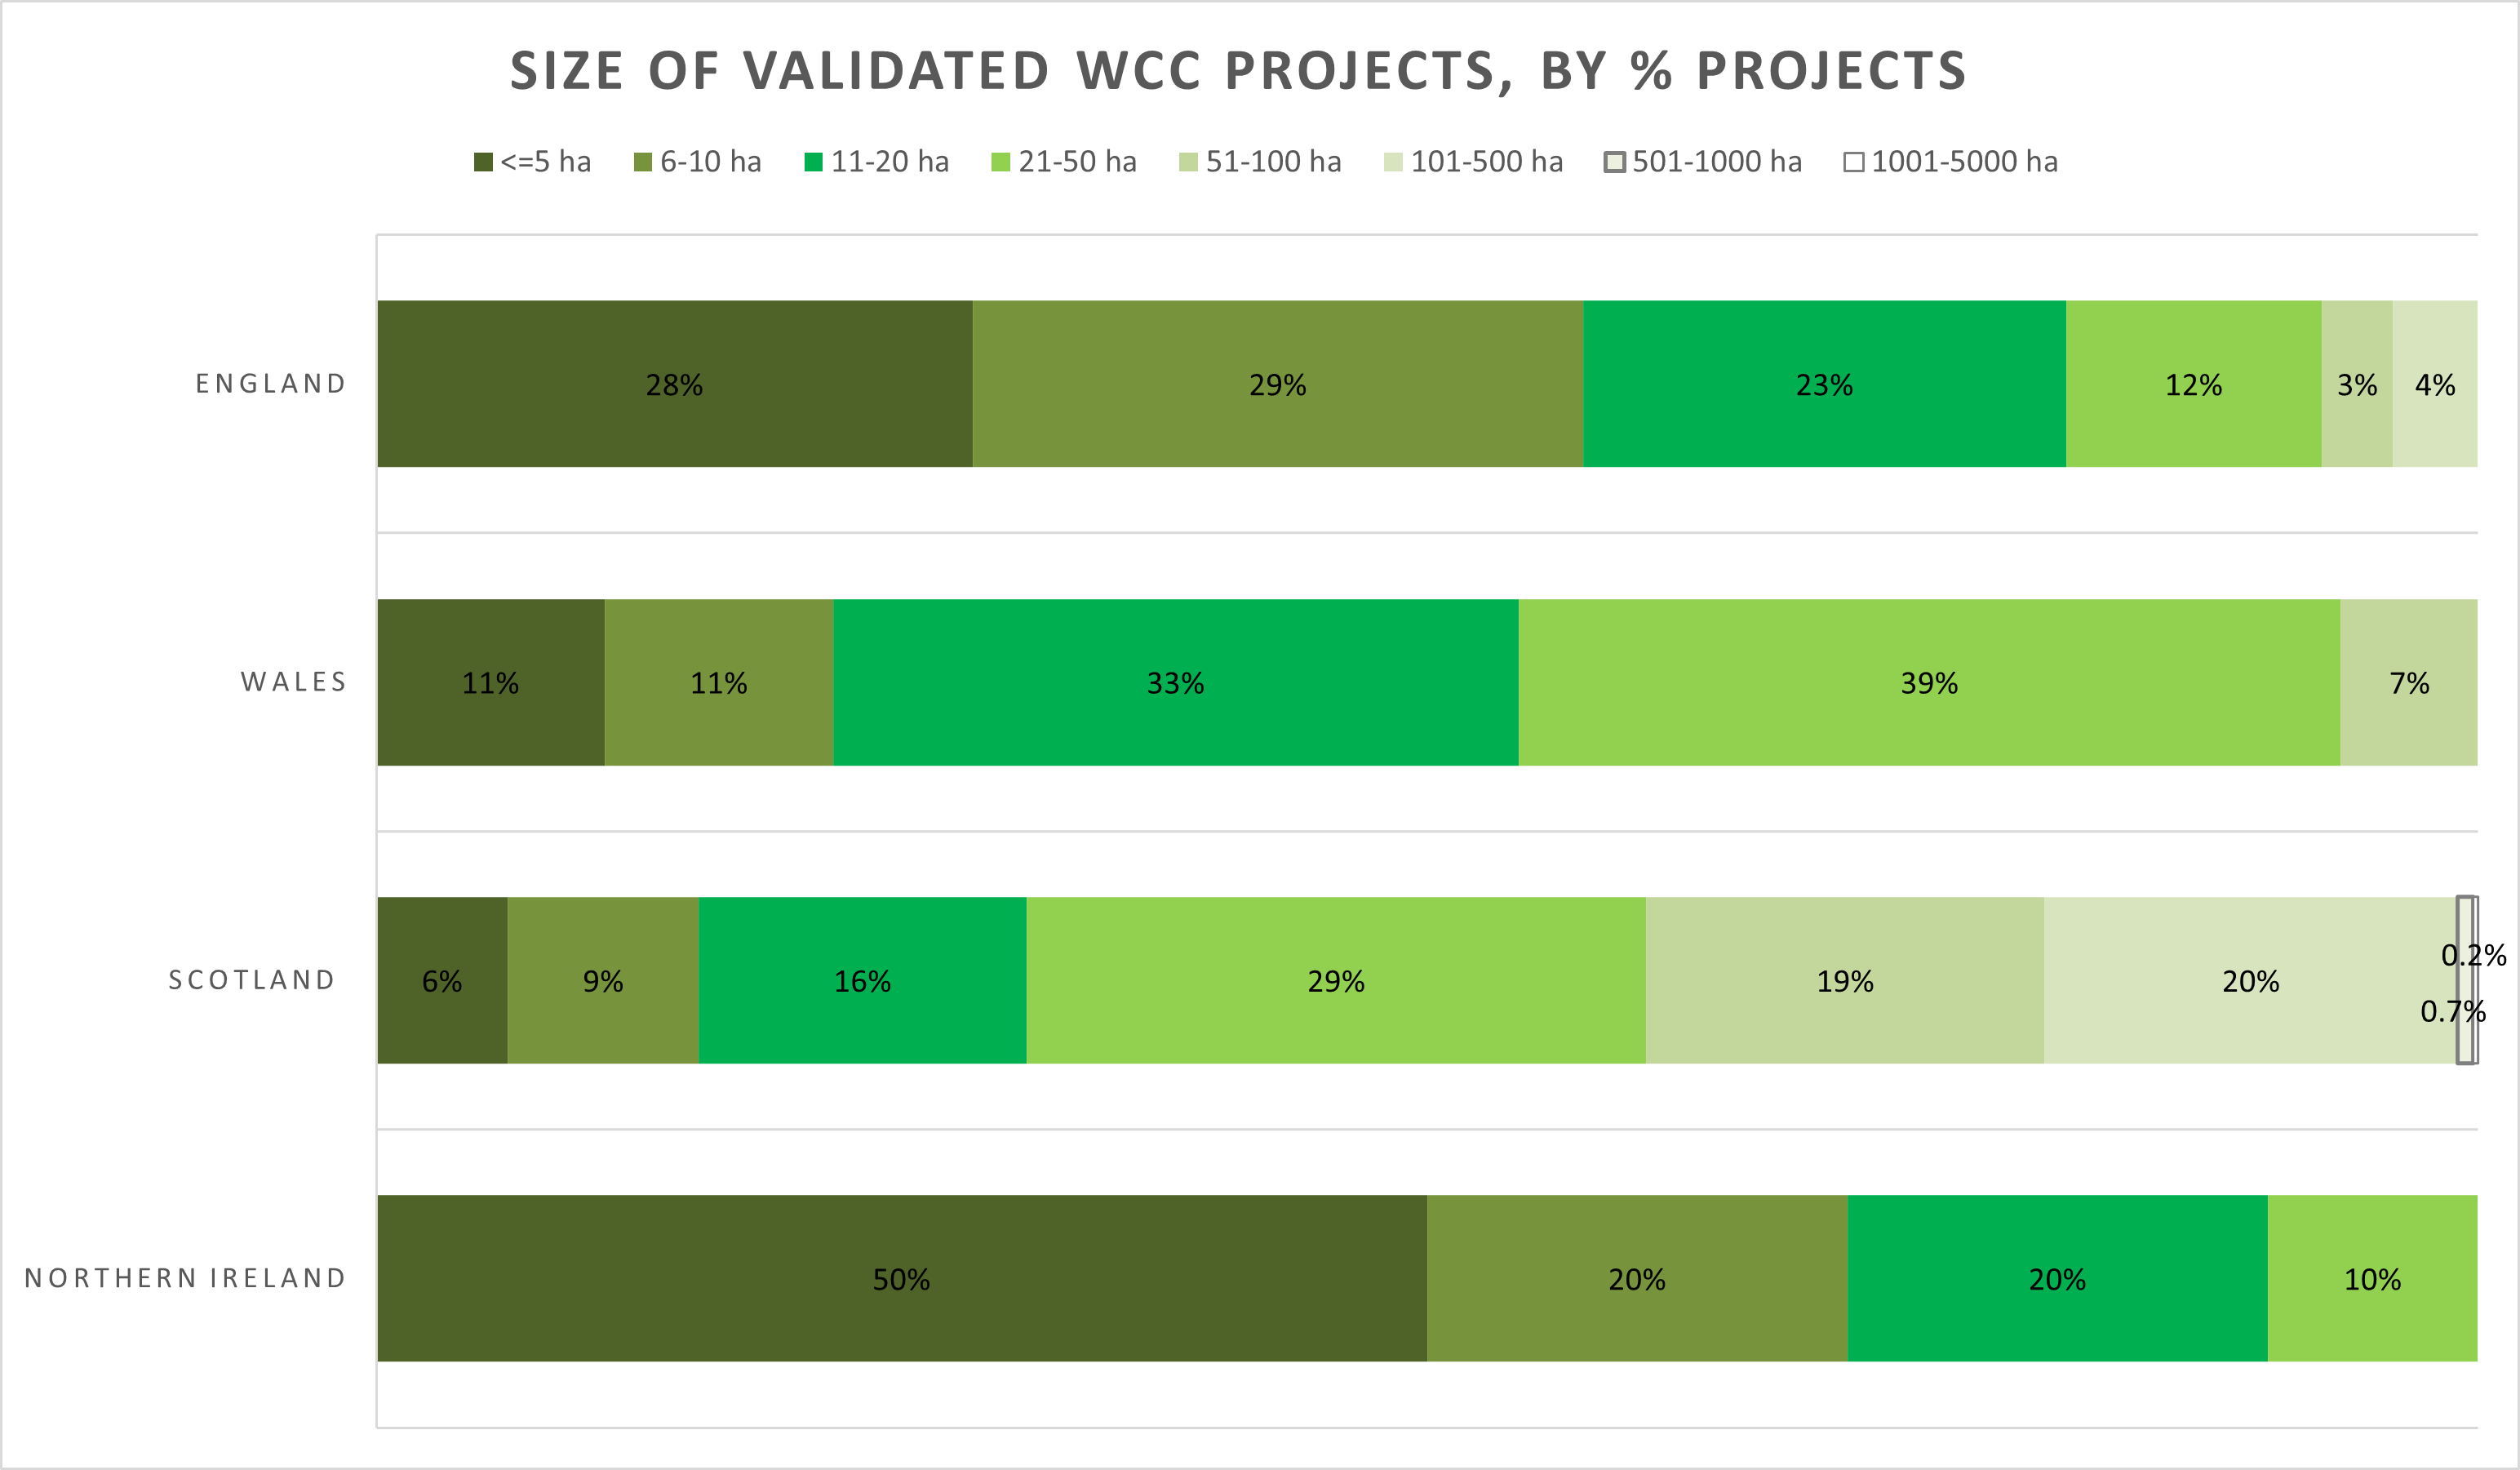
Size of validated and verified projects, number of projects by country
Species mix of validated and verified projects, by area and country
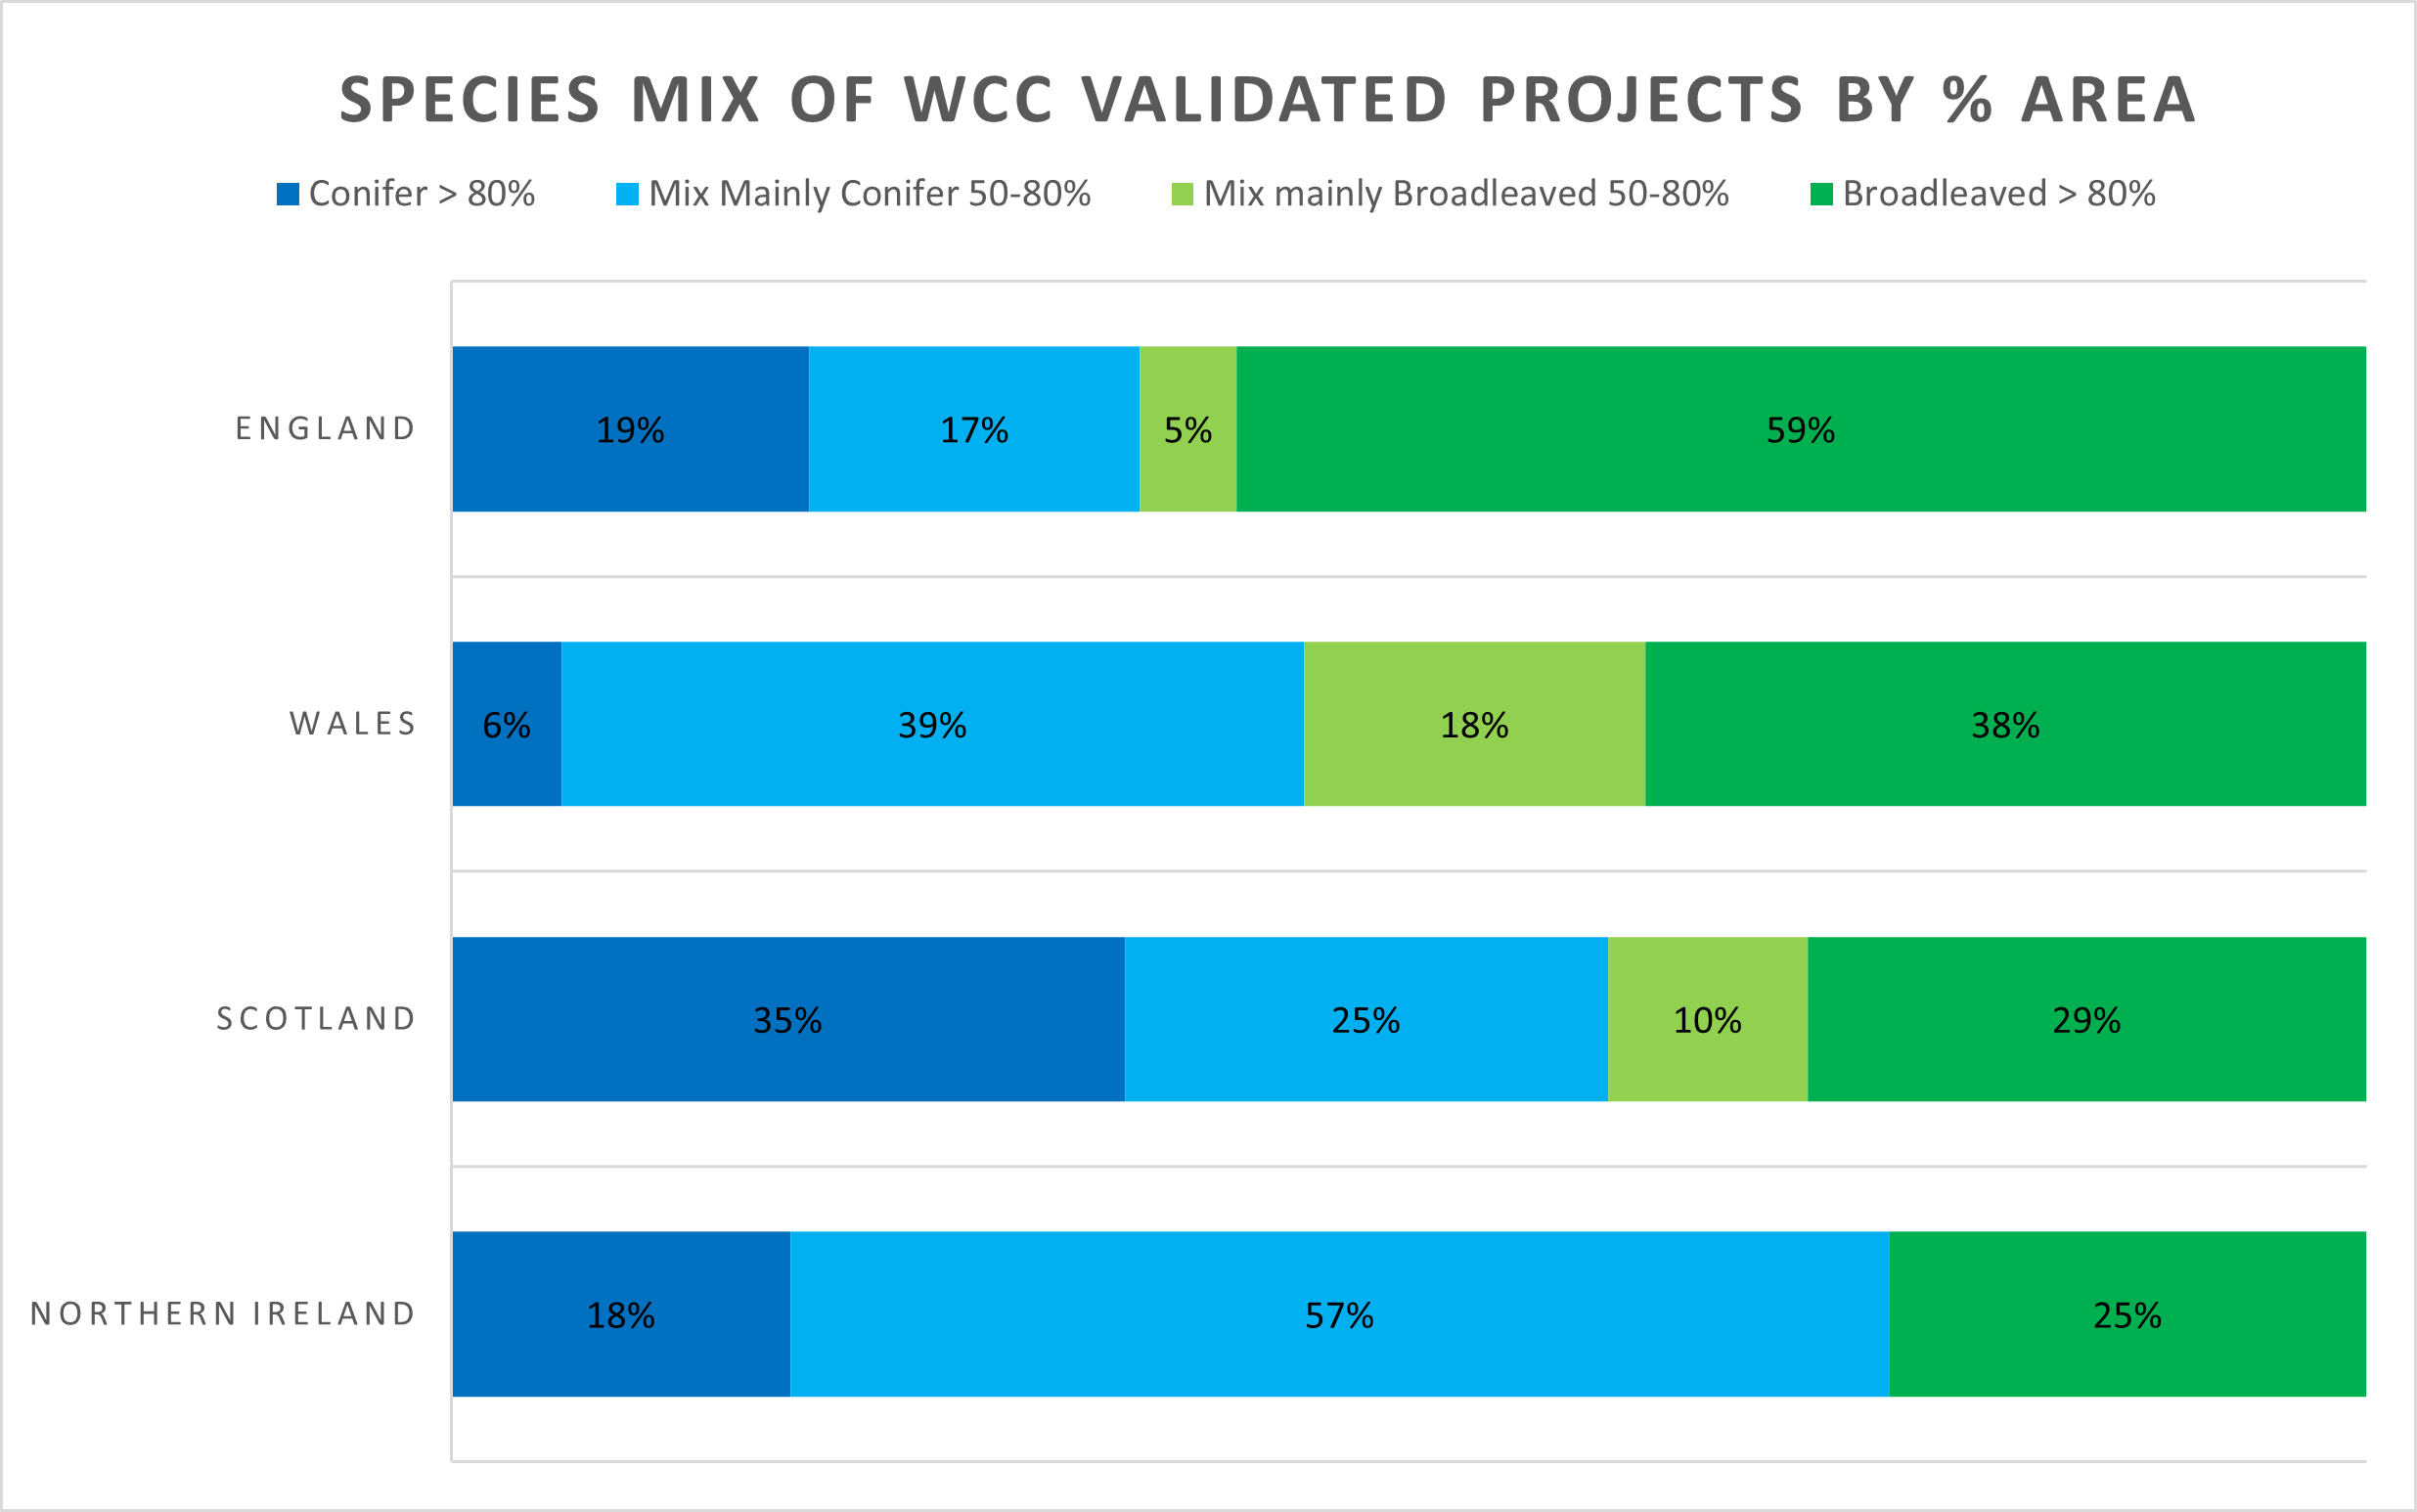
Note: In Scotland, conifers include native Scots Pine, frequently planted as part of native woodlands.
Management of validated and verified projects, by area and country
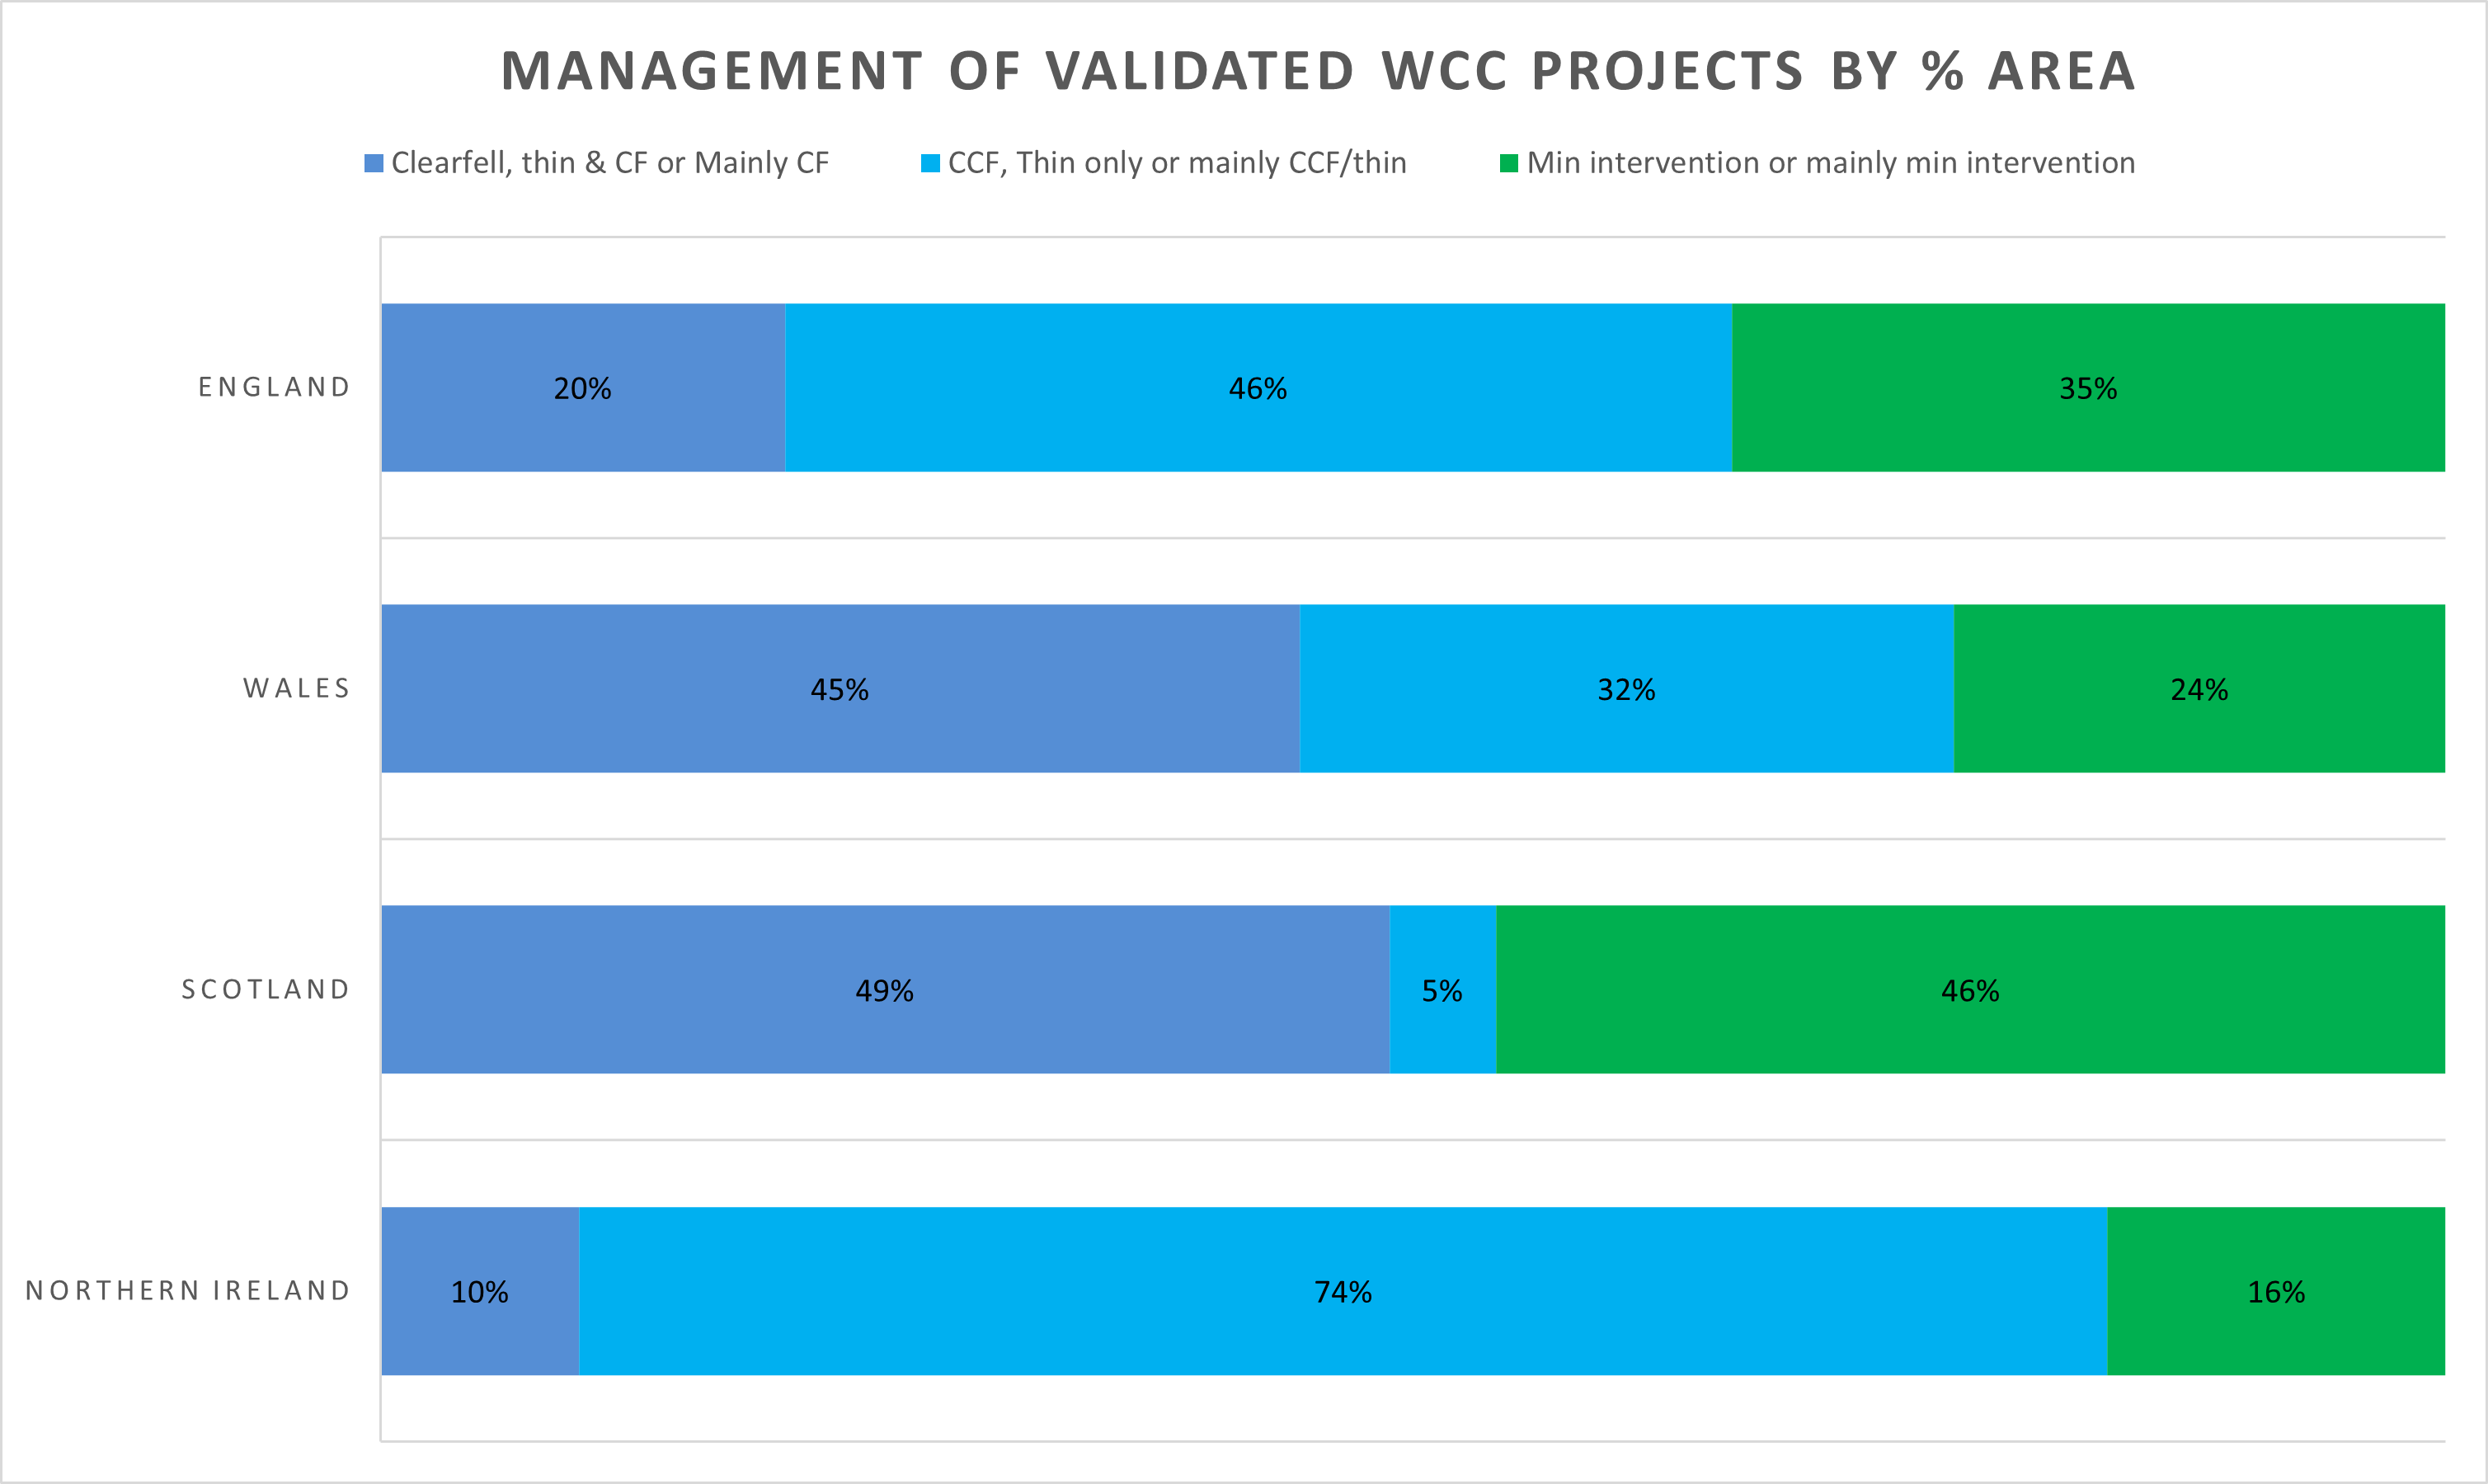
Note: CCF is Continuous Cover Forestry.
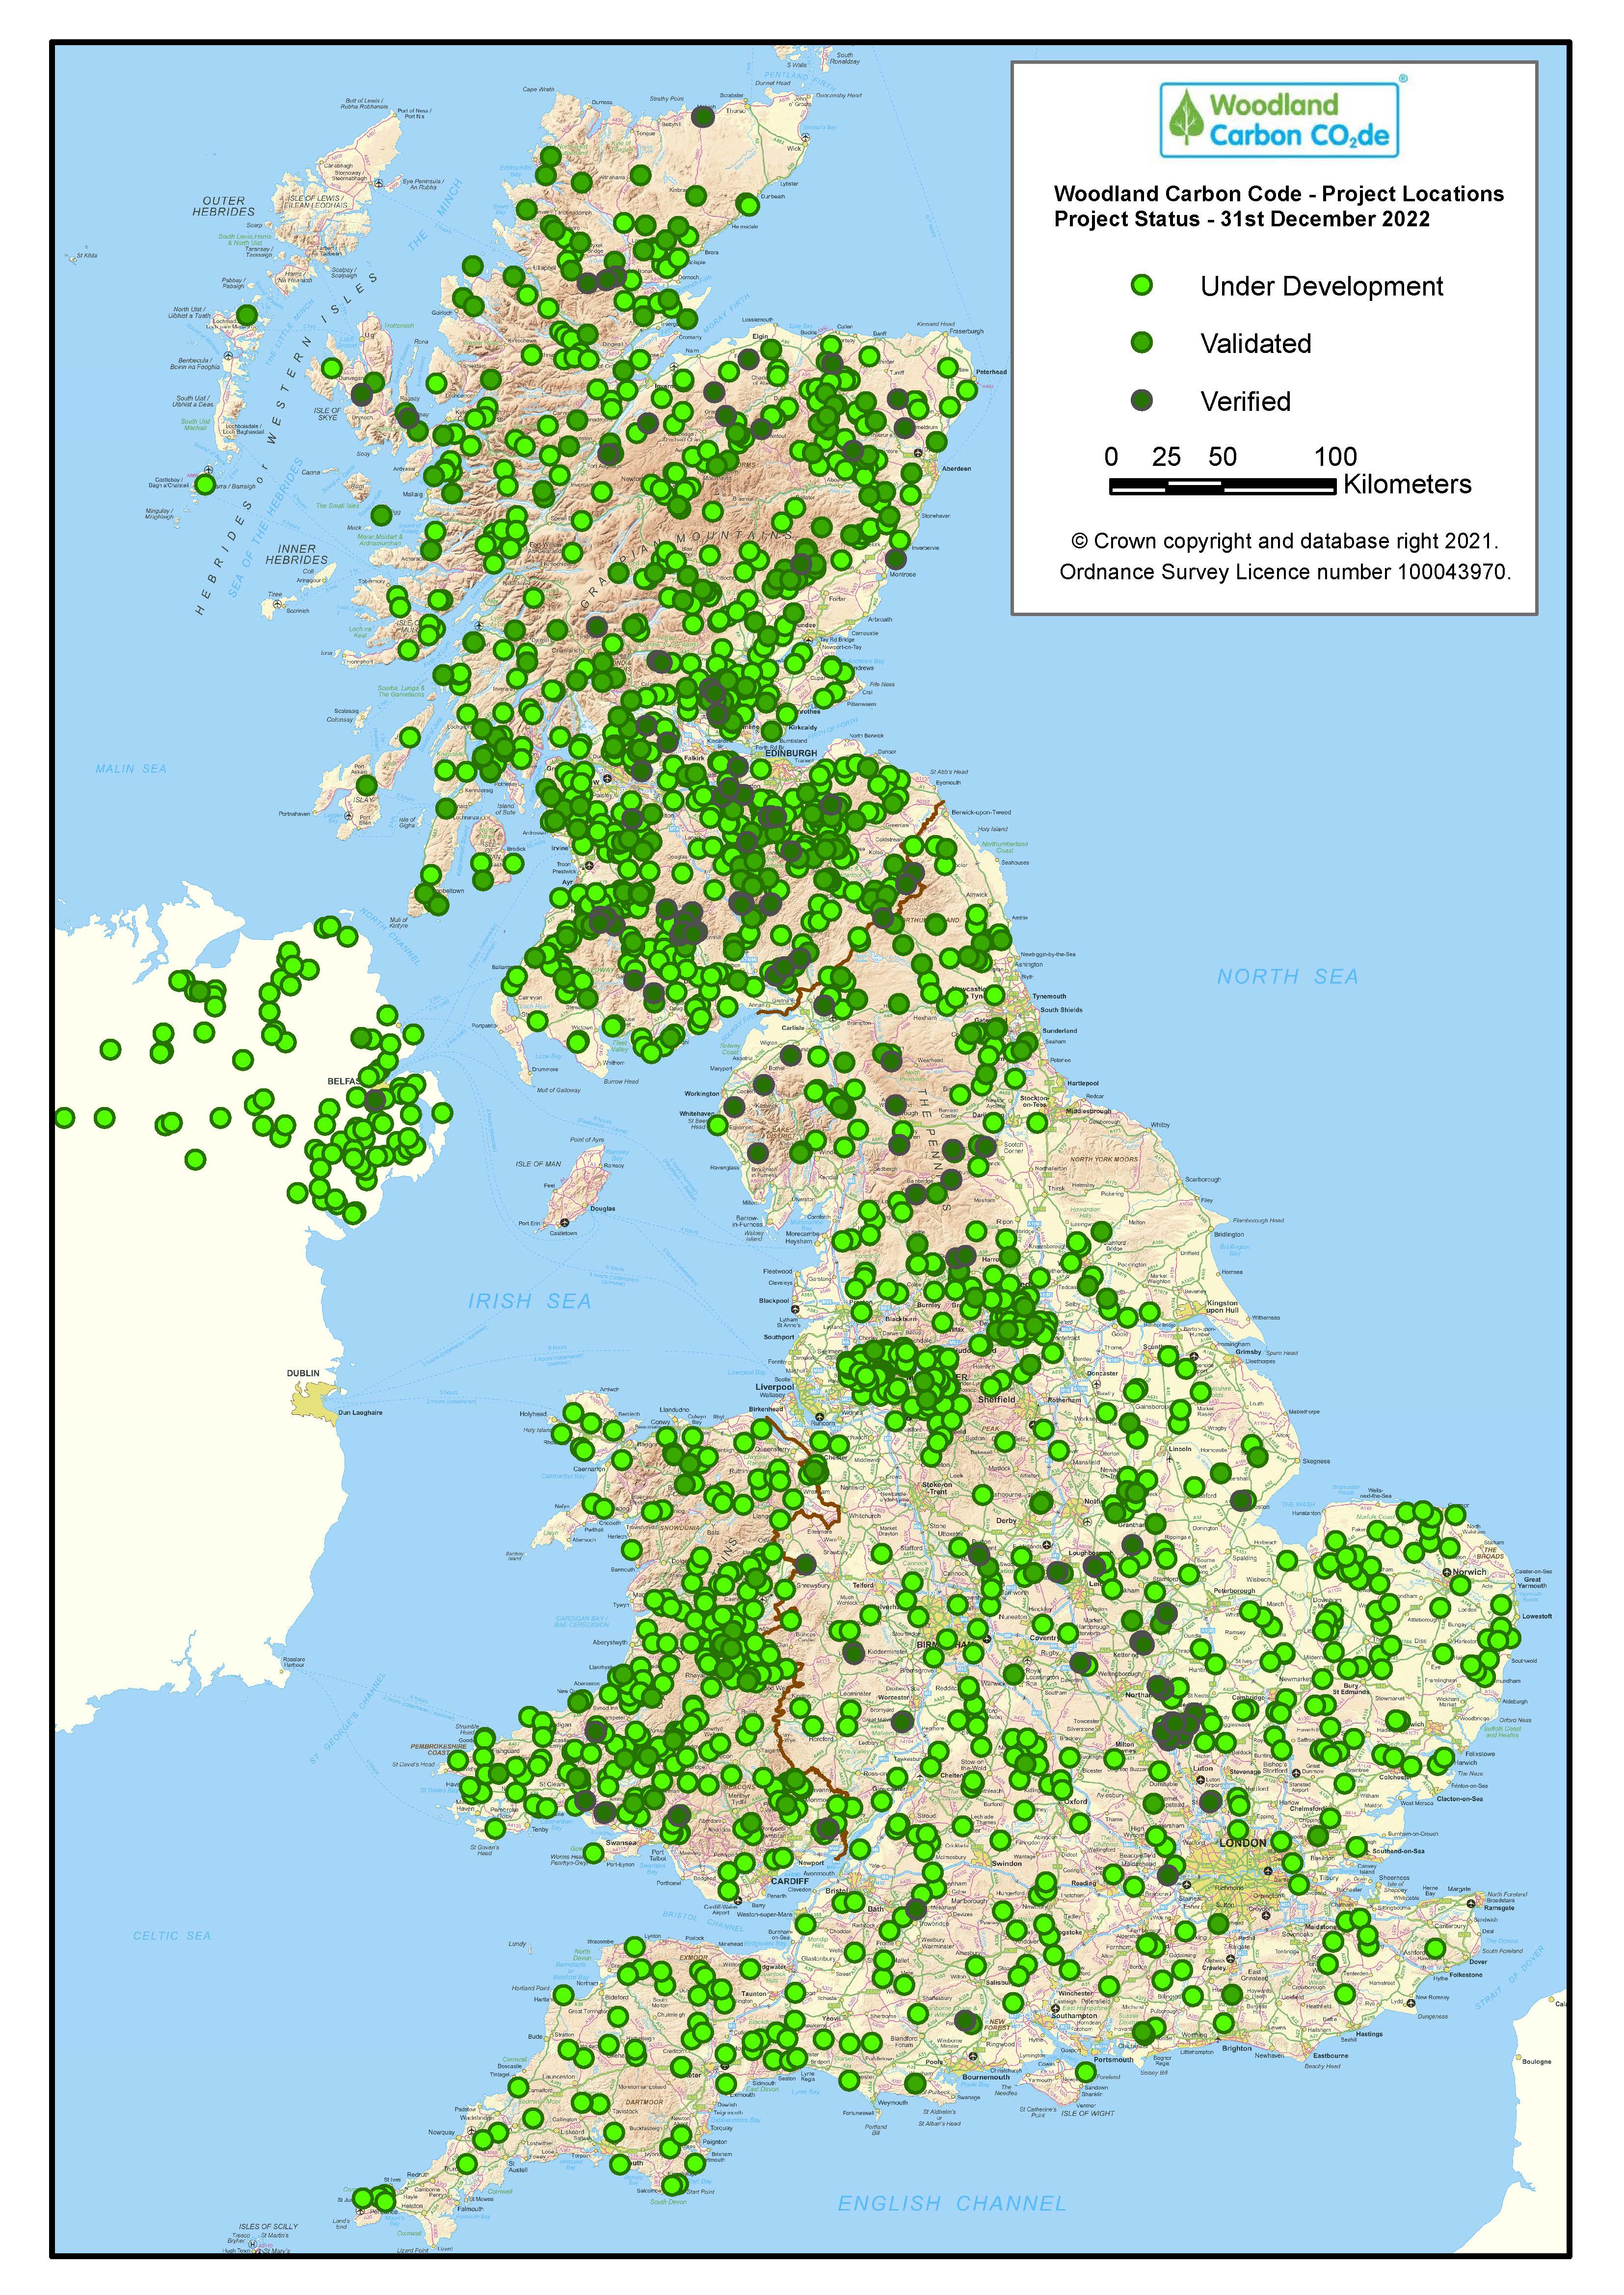
Map of projects, by status - 31 December 2022
Interim carbon unit statistics
Our interim carbon unit statistics provide data from Woodland Carbon Code projects up to 31 March 2024.
Number of Woodland Carbon Units available on UK Land Carbon Registry
1 Carbon Unit = 1 Tonne of carbon dioxide equivalent
'Available for sale' units are for sale by the project developer or a retail aggregator - Find out how and where to buy.
'Already sold' units are either transferred from the project developer to a corporate buyer's account or assigned to a corporate buyer (if Pending Issuance Units)
Landowners 'growing their own' units are owned by organisations planning to use the units that will be verified against emissions within their own company/organisational boundaries (insetting).
'Retired Woodland Carbon Units' are verifed credits which are 'retired' or taken out of use by the final user.
Woodland Carbon Code Buffer Units are units which are put aside and stored in a shared buffer pool in case of any future loss of Woodland Carbon Units.
| Available for sale | Already sold | Landowners 'growing their own' units | Retired Woodland Carbon Units | Woodland Carbon Code Buffer Units | Total | |
|---|---|---|---|---|---|---|
|
Pending Issuance Units |
4,678,000 | 3,342,000 | 91,000 | -- | 2,072,000 | 10,183,000 |
| Woodland Carbon Units | 800 | 3,500 | 1,100 | 4,600 | 2,300 | 12,300 |
Note: Pending Issuance Units are validated units of CO2e which are projected to be delivered/sequestered in future. Woodland Carbon Units are verified units of actual sequestered CO2e.
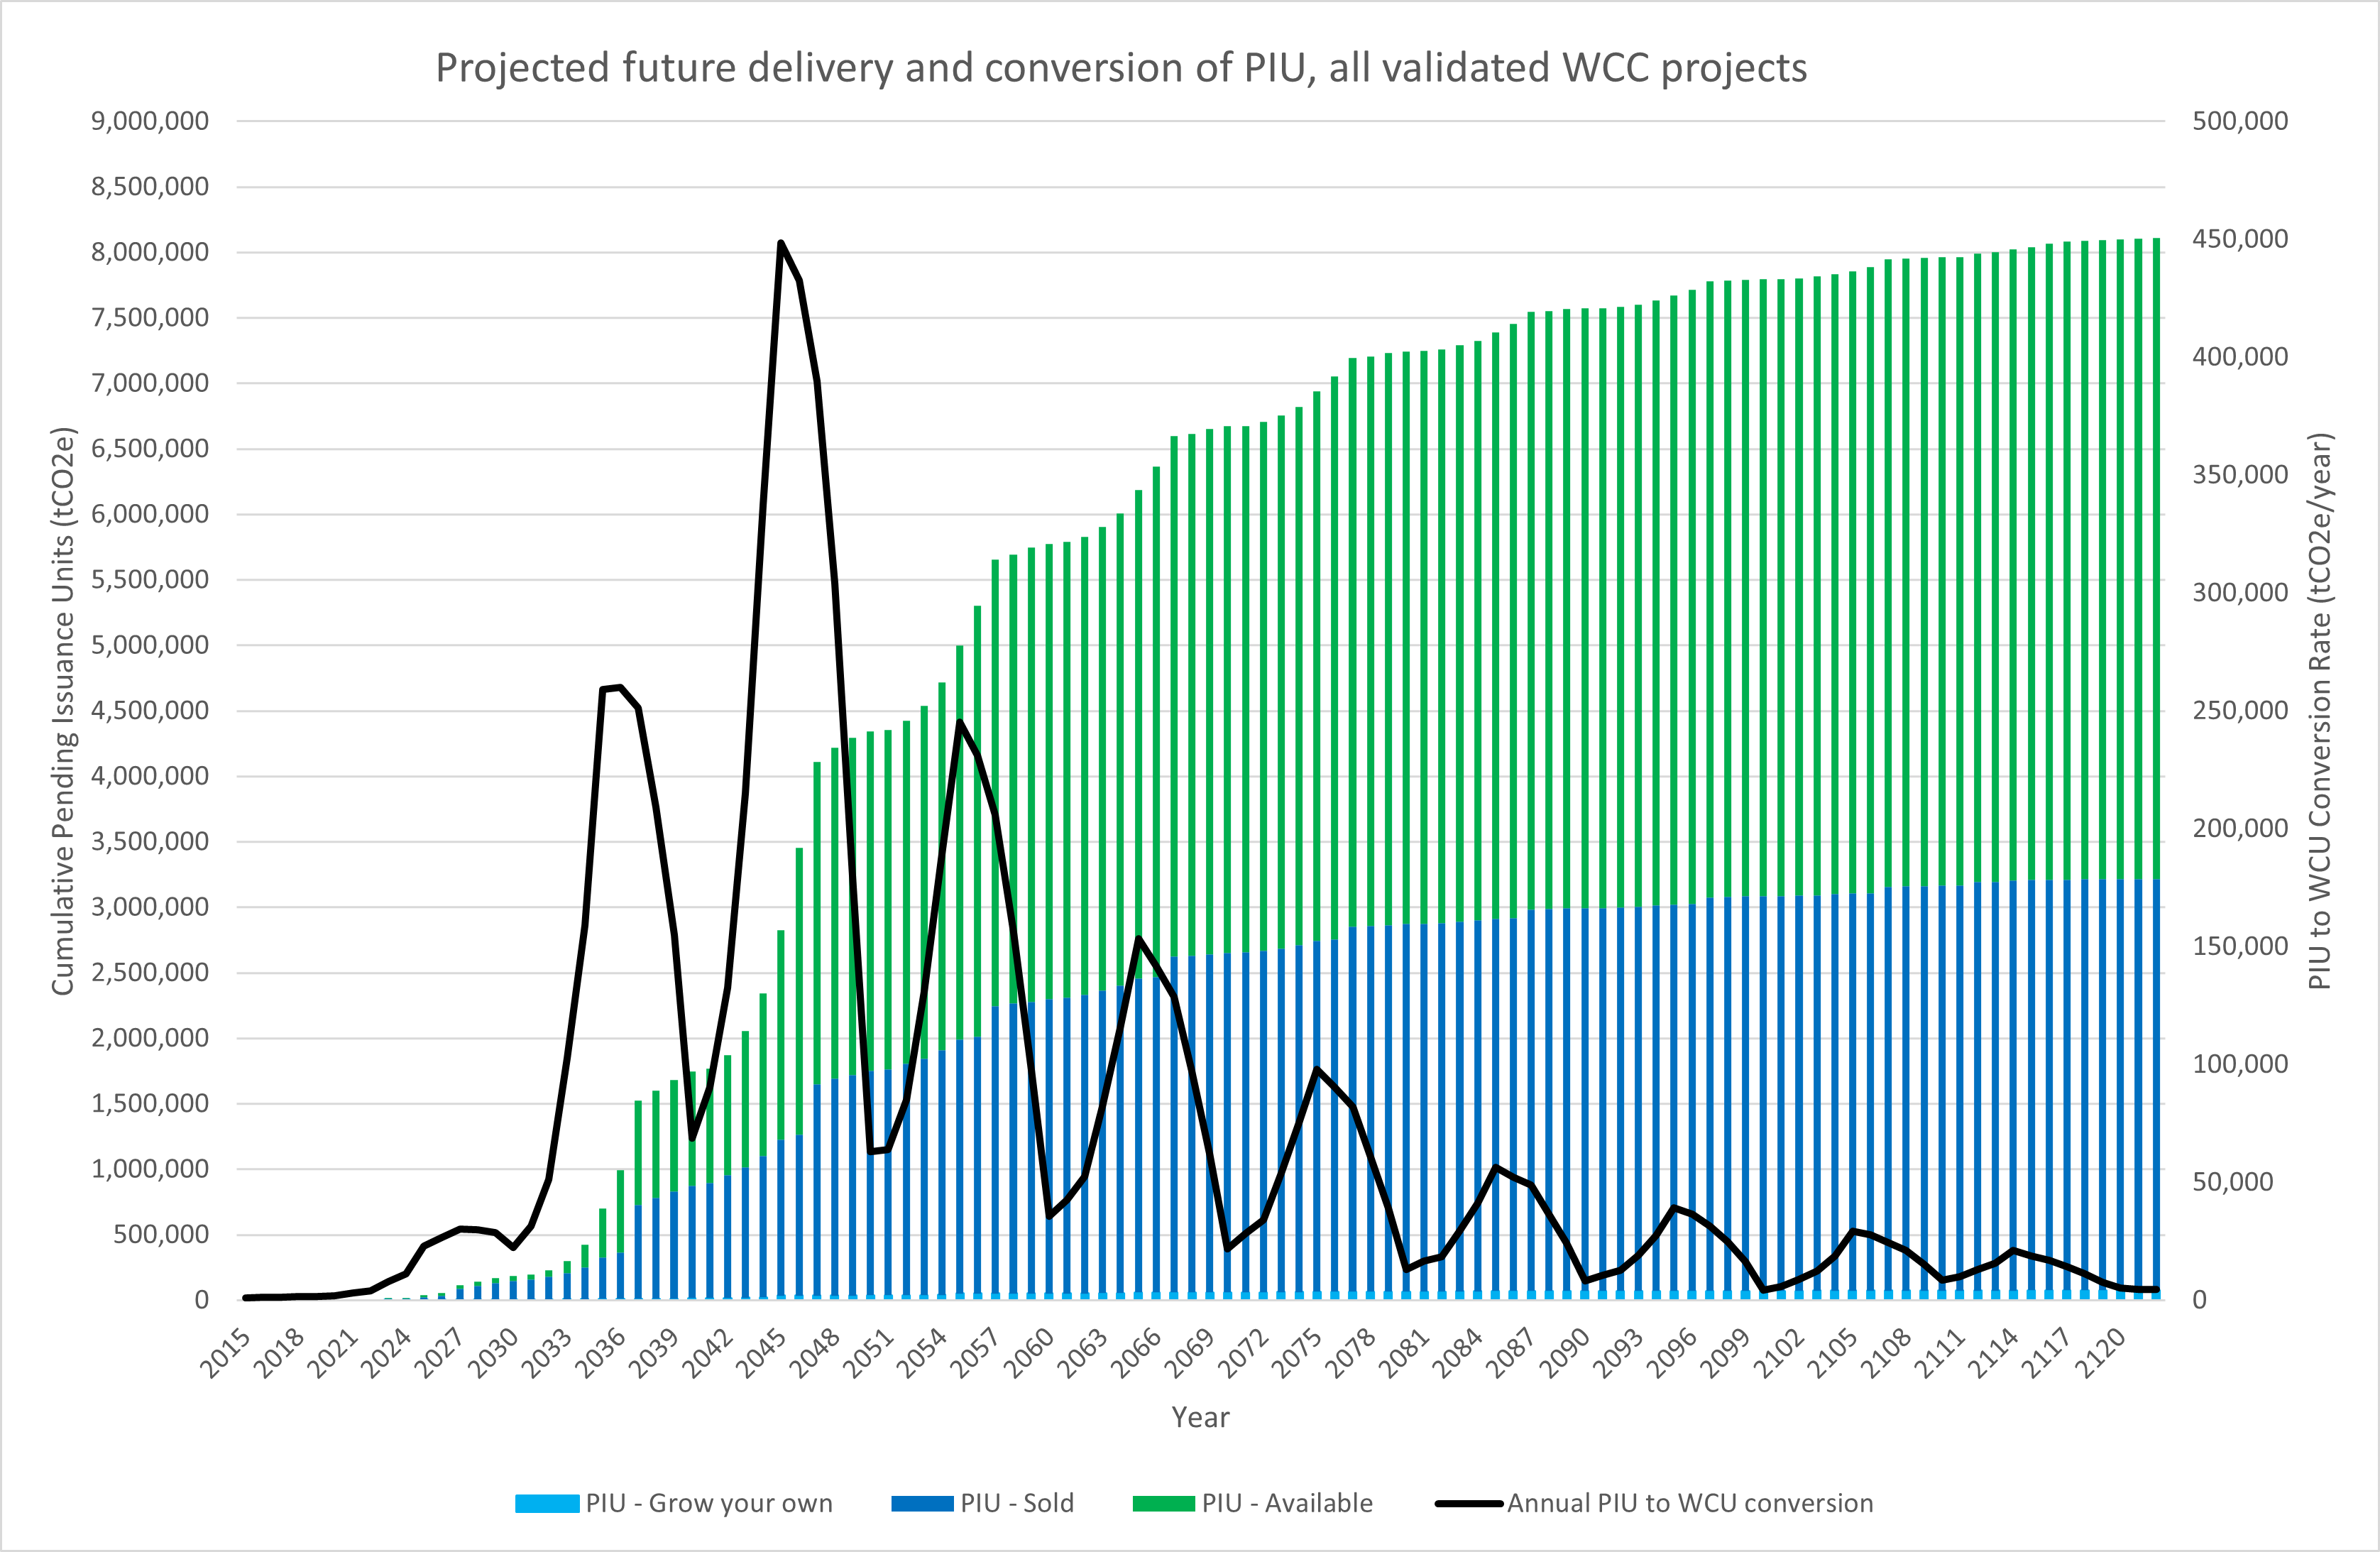
When will Pending Issuance Units convert to verifed Woodland Carbon Units?
Woodlands validated to the Woodland Carbon Code will sequester carbon dioxide over the coming 100 years.
The chart below shows the projected annual 'conversion rate' of Pending Issuance Units to Woodland Carbon Units over that time period (black line) and the cumulative sequestration of validated projects over that time (bars).
As more projects are validated to the standard, more units will be available and the conversion rate will increase. Verifed Woodland Carbon Units and Buffer Units are not included on the chart.